How Heatmaps Reveal Conversion Barriers
Understanding why users do not convert is one of the hardest challenges in digital marketing. Analytics can tell you what users do, but not why they behave that way. Heatmaps solve this gap by visually showing where users click, scroll, or pause on your website. They translate complex behavioural data into simple visual insights that reveal conversion barriers and usability issues.
For businesses aiming to improve performance, heatmaps are an essential tool. They help identify design flaws, misplaced content, and friction points that stop users from completing actions such as purchases, form submissions, or bookings.
What Are Heatmaps
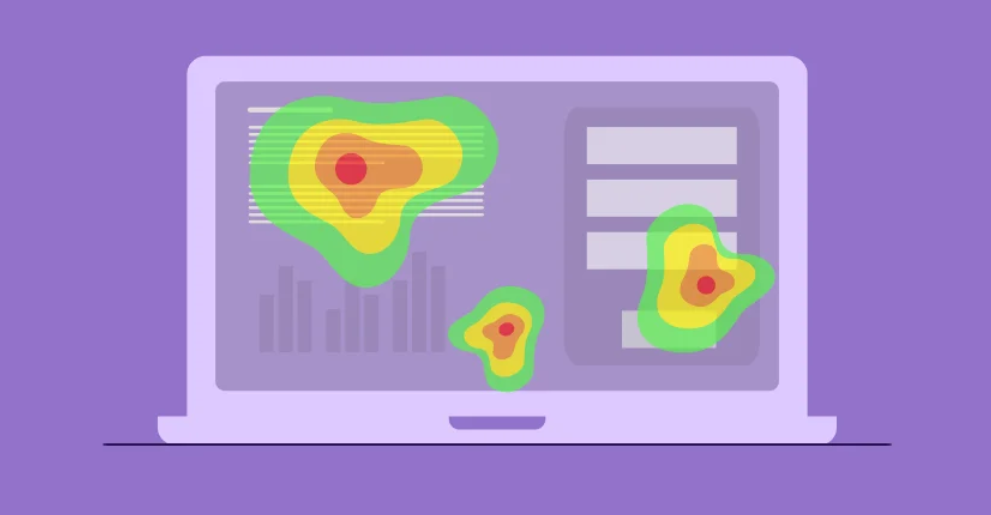
Heatmaps are visual representations of user activity on a webpage. They use colour gradients to show areas of high and low engagement. Warm colours like red and orange indicate strong interaction, while cool colours like blue and green represent low engagement.
Different types of heatmaps provide specific insights:
- Click maps show where users click or tap the most.
- Scroll maps display how far users scroll before leaving the page.
- Move maps track where users hover their cursor, revealing attention zones.
- Eye-tracking heatmaps (from advanced tools) show where users visually focus first.
A professionalc digital marketing agency combines these insights to diagnose user behaviour patterns and identify what stops visitors from converting.
See also: 5 Stress Management Techniques for a Healthier Mind
Why Heatmaps Matter for Conversion Optimisation
Conversion Rate Optimisation (CRO) aims to increase the percentage of visitors who take desired actions. Heatmaps reveal the hidden causes behind poor performance, showing not only what users ignore but also what distracts them.
For example:
- A poorly placed call-to-action (CTA) may receive fewer clicks if it sits below the fold.
- Distracting elements like pop-ups or banners can divert attention away from key conversion buttons.
- Users may leave forms halfway if fields appear too long or confusing.
By interpreting heatmap data, you can refine layouts, improve readability, and guide users more effectively through your conversion funnel.
Identifying Click and Attention Gaps
Click maps are particularly useful for detecting interaction issues. If users frequently click on non-clickable elements like images or icons, it signals design confusion.
For example, if users click repeatedly on a decorative image expecting it to lead to a product page, you may need to make that image a link. Similarly, if key buttons such as “Add to Cart” or “Contact Us” receive minimal clicks, it suggests either poor visibility or weak messaging.
By repositioning or redesigning these elements, you can capture lost opportunities and improve conversion flow.
Analysing Scroll Depth and Content Visibility
Scroll maps reveal how far visitors travel down your page. Many businesses assume users see all their content, but heatmaps often prove otherwise.
If a scroll map shows that most users drop off before reaching your main offer or form, you may need to move those elements higher on the page.
Long landing pages with buried CTAs or essential details hidden below the fold lose conversions simply because users never see them. Heatmaps help pinpoint the optimal placement for key information, ensuring it appears where users are most engaged.
Understanding User Friction Points
User friction occurs when design, copy, or navigation elements make it harder for visitors to complete an action. Heatmaps expose these barriers by revealing behavioural inconsistencies.
Examples of friction include:
- High activity in navigation menus: Users may struggle to find specific pages.
- Low engagement with product descriptions: Content may be too long or irrelevant.
- Excessive interaction with page headers: Indicates visitors searching for information not easily found.
By studying these patterns, a skilled SEO Agency can identify usability issues and create design improvements that reduce hesitation and frustration.
Heatmaps and Mobile Behaviour
Mobile users interact differently from desktop users. They scroll faster, click less precisely, and have limited screen space. Heatmaps allow marketers to see these variations clearly.
A mobile heatmap might show that users ignore elements placed too close to screen edges or struggle to click small buttons. It might also reveal that key information disappears under pop-ups or sticky menus.
Optimising for mobile engagement often leads to significant conversion gains. Small layout adjustments, such as increasing button size or simplifying navigation, can dramatically improve performance.
Connecting Heatmaps with Analytics
While heatmaps show visual interaction, analytics platforms like Google Analytics reveal numerical data such as bounce rates, session durations, and exit points. When used together, they provide a complete picture.
For instance, if analytics show high bounce rates on a landing page, a heatmap can reveal whether users are leaving because they cannot find the CTA or because the page loads too slowly.
Integrating both tools ensures you base decisions on both data and context. A digital marketing agency typically uses this combination to guide comprehensive conversion strategies.
Testing and Iteration
Heatmap data is most powerful when paired with A/B testing. Once problem areas are identified, alternative designs or content variations can be tested.
For example:
- Moving the CTA higher on the page.
- Changing button colours or wording.
- Reducing unnecessary form fields.
Testing confirms whether the changes improve engagement or conversions. Over time, this process builds cumulative improvements that strengthen your site’s performance and ROI.
Heatmaps for E-Commerce and Lead Generation
E-commerce sites and lead generation businesses gain the most from heatmaps because they rely heavily on conversions.
For e-commerce, click and scroll heatmaps help determine:
- Which products or banners attract the most attention.
- How far users scroll through product listings.
- Whether checkout elements create confusion or drop-offs.
For service-based businesses, heatmaps can show whether visitors engage with testimonials, pricing tables, or booking forms. If visitors abandon a form midway, reviewing heatmap data often reveals whether the layout or copy caused friction.
Common Heatmap Mistakes
Some marketers misuse heatmap data by focusing on aesthetics rather than insights. Common mistakes include:
- Overreacting to isolated data from small sample sizes.
- Ignoring context such as traffic source or device type.
- Making assumptions without validating through testing.
Heatmaps show where users behave a certain way but not why. Always interpret findings alongside other data and feedback.
Turning Insights into Action
The ultimate goal of heatmaps is action. Once conversion barriers are identified, you must prioritise and implement solutions. This may include redesigning layouts, simplifying forms, improving page speed, or rewriting unclear CTAs.
An experienced SEO Agency or digital marketing agency will interpret heatmap data accurately and translate it into specific improvements that align with your overall marketing goals.
Conclusion
Heatmaps provide a clear window into user behaviour. They help you see what traditional analytics cannot: where users get stuck, what they ignore, and why they leave.
By using heatmaps effectively, businesses can eliminate friction, optimise design, and guide visitors toward conversion. When integrated into a broader SEO and CRO strategy, they transform your website into a more intuitive, data-driven platform for growth.